| Resilience |
Adult (18 + years) |
In development
|
NA
|
NA
|
NA
|
| Resilience |
Youth (12-17 years) |
In development
|
N/A
|
N/A
|
NA
|
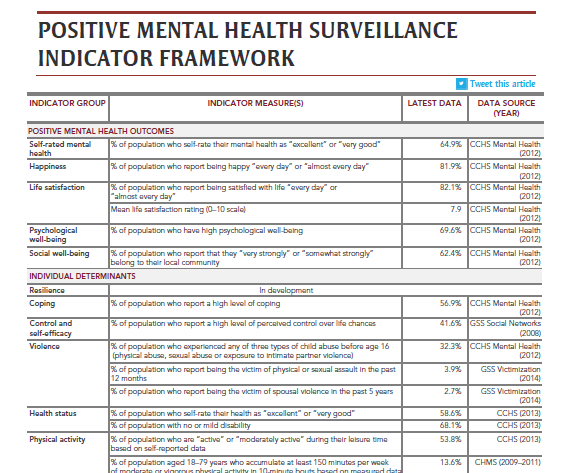
| Coping |
Adult (18 + years) |
% of population who report a high level of coping
|
56.9%
|
CCHS Mental Health (2012)
|
Description of % of population who report a high level of coping
|
| Coping |
Youth (12-17 years) |
% of population aged 15–17 years who report a high level of coping
|
43.30%
|
CCHS Mental Health (2012)
|
Description of % of population aged 15–17 years who report a high level of coping
|
| Nurturing Childhood Environment |
Youth (12-17 years) |
% of grade 6–10 students who report having dinner together with their family five or more times per week
|
69.80%
|
HBSC (2013–2014)
|
Description of % of grade 6–10 students who report having dinner together with their family five or more times per week
|
| Nurturing Childhood Environment |
Youth (12-17 years) |
% of grade 6–10 students who report their family is willing to help them make decisions
|
74.20%
|
HBSC (2013–2014)
|
Description of % of grade 6–10 students who report their family is willing to help them make decisions
|
| Control and Self-efficacy |
Adult (18 + years) |
% of population who report a high level of perceived control over life chances
|
41.6%
|
GSS Social Networks (2008)
|
Description of % of population who report a high level of perceived control over life chances
|
| Control and Self-efficacy |
Youth (12-17 years) |
% of population aged 15–17 years who report a high level of perceived control over life chances
|
45%
|
GSS Social Networks (2008)
|
Description of % of population aged 15–17 years who report a high level of perceived control over life chances
|
| Violence |
Adult (18 + years) |
% of population who experienced any of three types of child abuse before age 16 (physical abuse, sexual abuse or exposure to intimate partner violence)
|
32.3%
|
CCHS Mental Health (2012)
|
Description of % of population who experienced any of three types of child abuse before age 16 (physical abuse, sexual abuse or exposure to intimate partner violence)
|
| Violence |
Adult (18 + years) |
% of population who report being the victim of physical or sexual assault in the past 12 months
|
3.9%
|
GSS Victimization (2014)
|
Description of % of population who report being the victim of physical or sexual assault in the past 12 months
|
| Violence |
Adult (18 + years) |
% of population who report being the victim of spousal violence in the past 5 years
|
2.7%
|
GSS Victimization (2014)
|
Description of % of population who report being the victim of spousal violence in the past 5 years
|
| Violence |
Youth (12-17 years) |
% of grade 6–10 students who report they were in a physical fight at least once in the past 12 months
|
28.30%
|
HBSC (2013–2014)
|
Description of % of grade 6–10 students who report they were in a physical fight at least once in the past 12 months
|
| Violence |
Youth (12-17 years) |
% of grade 6–12 students who report they have been bullied by other students in the past 30 days
|
25.10%
|
CSTADS (2014–2015)
|
Description of % of grade 6–12 students who report they have been bullied by other students in the past 30 days
|
| Violence |
Youth (12-17 years) |
% of grade 6–12 students who report they have bullied other students in the past 30 days
|
14%
|
CSTADS (2014–2015)
|
Description of % of grade 6–12 students who report they have bullied other students in the past 30 days
|
| Health Status |
Adult (18 + years) |
% of population who self-rate their health as “excellent” or “very good”
|
58.6%
|
CCHS (2013)
|
Description of % of population who self-rate their health as “excellent” or “very good”
|
| Health Status |
Adult (18 + years) |
% of population with no or mild disability
|
68.1%
|
CCHS (2013)
|
Description of % of population with no or mild disability
|
| Health Status |
Youth (12-17 years) |
% of population who self-rate their health as “excellent” or “very good”
|
70%
|
CCHS (2014)
|
Description of % of population who self-rate their health as “excellent” or “very good”
|
| Health Status |
Youth (12-17 years) |
% of population with no disability or mild disability
|
70.10%
|
CCHS (2014)
|
Description of % of population with no disability or mild disability
|
| Physical Activity |
Adult (18 + years) |
% of population who are “active” or “moderately active” during their leisure time based on self-reported data
|
53.8%
|
CCHS (2013)
|
Description of % of population who are “active” or “moderately active” during their leisure time based on self-reported data
|
| Physical Activity |
Adult (18 + years) |
% of population aged 18–79 years who accumulate at least 150 minutes per week of moderate or vigorous physical activity in 10-minute bouts based on measured data
|
13.6%
|
CHMS (2009–2011)
|
Description of % of population aged 18–79 years who accumulate at least 150 minutes per week of moderate or vigorous physical activity in 10-minute bouts based on measured data
|
| Physical Activity |
Youth (12-17 years) |
% of population who meet physical activity recommendations by accumulating at least 60 minutes of moderate-to-vigorous physical activity per day
|
4.30%
|
CHMS (2009–2013)
|
Description of % of population who meet physical activity recommendations by accumulating at least 60 minutes of moderate-to-vigorous physical activity per day
|
| Substance Use |
Adult (18 + years) |
% of population whose reported alcohol consumption falls within the low-risk alcohol drinking guidelines
|
85.0%
|
CADUMS (2012)
|
Description of % of population whose reported alcohol consumption falls within the low-risk alcohol drinking guidelines
|
| Substance Use |
Youth (12-17 years) |
% of grade 9 and 10 students who report they have had 5 or more drinks (4 or more for girls) on one occasion, once a month or more in the past year
|
17.70%
|
HBSC (2013–2014)
|
Description of % of grade 9 and 10 students who report they have had 5 or more drinks (4 or more for girls) on one occasion, once a month or more in the past year
|
| Substance Use |
Youth (12-17 years) |
% of grade 6–10 students who report drinking alcohol every week or more
|
6.50%
|
HBSC (2013–2014)
|
Description of % of grade 6–10 students who report drinking alcohol every week or more
|
| Substance Use |
Youth (12-17 years) |
% of grade 7–12 students who have used marijuana or cannabis in the past 12 months
|
16.50%
|
CSTADS (2014–2015)
|
Description of % of grade 7–12 students who have used marijuana or cannabis in the past 12 months
|
| Spirituality |
Adult (18 + years) |
% of population who report that religious or spiritual beliefs are “very important” or “somewhat important” in their daily life
|
62.9%
|
CCHS Mental Health (2012)
|
Description of % of population who report that religious or spiritual beliefs are “very important” or “somewhat important” in their daily life
|
| Spirituality |
Youth (12-17 years) |
% of population aged 15–17 years who report that religious or spiritual beliefs are “very important” or “somewhat important” in their daily life
|
45.70%
|
CCHS Mental Health (2012)
|
Description of % of population aged 15–17 years who report that religious or spiritual beliefs are “very important” or “somewhat important” in their daily life
|