Health Inequalities Data Tool

Health inequalities refer to differences in health status between groups in society. These differences can be due to biological factors, individual choices, or chance, but public health evidence suggests that many are attributable to the unequal distribution of the social and economic factors that influence health (e.g. income, education, employment, social supports) and exposure to societal conditions and environments largely beyond the control of the individuals concerned.

In 2012, Canada, along with other World Health Organization (WHO) Member States, endorsed the Rio Political Declaration on Social Determinants of Health, pledging to take action to promote health equity (defined by the WHO as “the absence of avoidable or remediable differences among groups of people”). Strengthening the capacity to monitor and report on health inequalities was recognized as a critical foundation for achieving meaningful progress towards this goal.

The Health Inequalities Data Tool supports Canada’s pledges under the Rio Declaration. This resource is a collaborative effort of the Public Health Agency of Canada, the Pan-Canadian Public Health Network (PHN), Statistics Canada, and the Canadian Institute for Health Information, and builds on a set of indicators of health inequalities proposed by the PHN in 2010.

The Health Inequalities Data Tool contains data on indicators of health status and health determinants, stratified by a range of social and economic characteristics (i.e. social stratifiers) meaningful to health equity. Indicators are grouped into twelve framework components.
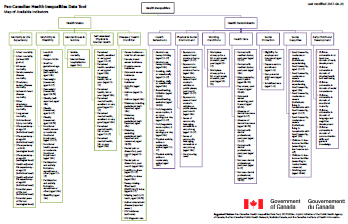
A map of available indicators. For an accessible equivalent, please use the table below.
Map of Available Indicators ( .pdf document)

More Information

For more information about each indicator, click on the framework components below:

Health Status

Morbidity and Disability
Indicator Details Source (Year) Method of Calculation Available Stratifiers
Low birth weight (incidence rate per 100 live births) Live births with birth weight less than 2,500 grams VS-BD (2009-2011) Numerator: Total number of live births with a birth weight < 2,500 grams; Denominator: Total number of live births with known weight (Ontario is excluded from the numerator and denominator) Details of Low birth weight (incidence rate per 100 live births)
Small for gestational age (incidence rate per 100 live births) Live singleton births whose birth weight is below the 10th percentile of sex-specific birth weight for gestational age VS-BD (2009-2011) Numerator: Total number of live singleton births with a birth weight < 10th percentile of sex-specific birth weight for gestational age; Denominator: Total number of singleton live births with known weight and known gestational age (between 22 and 43 weeks) (Ontario is excluded from the numerator and denominator) Details of Small for gestational age (incidence rate per 100 live births)
Preterm births (incidence rate per 100 live births) Live births with a gestational age of less than 37 weeks VS-BD (2009-2011) Numerator: Total number of live births with a gestational age < 37 weeks; Denominator: Total number of live births with known gestational age (Ontario is excluded from the numerator and denominator) Details of Preterm births (incidence rate per 100 live births)
Overweight (self-reported, aged 18+) (prevalence %) Body mass index (BMI) score from 25.0 to 29.9, based on self-reported height and weight, population aged 18+ years CCHS (2010-2013) Numerator: Number of CCHS respondents, aged 18+, with a BMI score between 25.0 and 29.9, based on self-reported height and weight; Denominator: CCHS respondents, aged 18+ Details of Overweight (self-reported, aged 18+) (prevalence %)
Overweight (measured, aged 6-17) (prevalence %) Body mass index (BMI) score from 25.0 to 29.9, based on measured height and weight, population aged 6-17 years CHMS (2009-2013) Numerator: Number of CHMS respondents, aged 6-17, with a BMI score from 25.0 to 29.9, based on measured height and weight; Denominator: CHMS respondents, aged 6-17 Details of Overweight (measured, aged 6-17) (prevalence %)
Overweight (measured, aged 18-79) (prevalence %) Body mass index (BMI) score from 25.0 to 29.9, based on measured height and weight, population aged 18-79 years CHMS (2009-2013) Numerator: Number of CHMS respondents, aged 18-79, with a BMI score from 25.0 to 29.9, based on measured height and weight; Denominator: CHMS respondents, aged 18-79 Details of Overweight (measured, aged 18-79) (prevalence %)
Obesity (self-reported, aged 18+) (prevalence %) Body mass index (BMI) score equal to 30.0 or above, based on self-reported height and weight, population aged 18+ years CCHS (2010-2013) Numerator: Number of CCHS respondents, aged 18+, with a BMI score equal to 30.0 or above, based on reported height and weight; Denominator: CCHS respondents, aged 18+ Details of Obesity (self-reported, aged 18+) (prevalence %)
Obesity (measured, aged 6-17) (prevalence %) Body mass index (BMI) score equal to 30.0 or above, based on measured height and weight, population aged 6-17 years CHMS (2009-2013) Numerator: Number of CHMS respondents, aged 6-17, with a BMI score equal to 30.0 or above, based on measured height and weight; Denominator: CHMS respondents, aged 6-17 Details of Obesity (measured, aged 6-17) (prevalence %)
Obesity (measured, aged 18-79) (prevalence %) Body mass index (BMI) score equal to 30.0 or above, based on measured height and weight, population aged 18-79 years CHMS (2009-2013) Numerator: Number of CHMS respondents, aged 18-79, with a BMI score equal to 30.0 or above, based on measured height and weight; Denominator: CHMS respondents, aged 18-79 Details of Obesity (measured, aged 18-79) (prevalence %)
Functional health, severe or moderate functional impairment (aged 12-17) (prevalence %) Have a moderate or severe functional impairment (Health Utilities Index Mark 3 [HUI3] score = 0.88), population aged 12-17 years CCHS (2009, 2010, 2013) Numerator: Number of CCHS respondents, aged 12-17, who have a HUI3 score = 0.88; Denominator: CCHS respondents, aged 12-17 Details of Functional health, severe or moderate functional impairment (aged 12-17) (prevalence %)
Functional health, severe or moderate functional impairment (aged 18+) (prevalence %) Have a moderate or severe functional impairment (Health Utilities Index Mark 3 [HUI3] score = 0.88), population aged 18+ years CCHS (2009, 2010, 2013) Numerator: Number of CCHS respondents, aged 18+, who had a HUI3 score = 0.88; Denominator: CCHS respondents, aged 18+ Details of Functional health, severe or moderate functional impairment (aged 18+) (prevalence %)
Participation and activity limitation, sometimes or often (aged 12-17) (prevalence %) Reported that they sometimes or often experienced limitations in daily activities related to a long-term physical health condition, mental health condition, or health problem (has lasted or is expected to last six months or longer) CCHS (2009, 2010, 2012, 2013) Numerator: Number of CCHS respondents, aged 12-17, who reported that they sometimes or often experienced a limitation in daily activities at home, at work, at school, or other, due to a long-term health condition (has lasted or is expected to last = 6 months); Denominator: CCHS respondents, aged 12-17 Details of Participation and activity limitation, sometimes or often (aged 12-17) (prevalence %)
Participation and activity limitation, sometimes or often (aged 18+) (prevalence %) Reported that they sometimes or often experienced limitations in daily activities related to a long-term physical health condition, mental health condition, or health problem (has lasted or is expected to last six months or longer) CCHS (2009, 2010, 2012, 2013) Numerator: Number of CCHS respondents, aged 18+, who reported that they sometimes or often experienced a limitation in daily activities at home, at work, at school, or other, due to a long-term health condition (has lasted or is expected to last = 6 months); Denominator: CCHS respondents, aged 18+ Details of Participation and activity limitation, sometimes or often (aged 18+) (prevalence %)
Disability (aged 15+) (prevalence %) Individuals with a mild, moderate, severe, or very severe disability (identified as such if an individual’s daily activities are limited as a result of an impairment or difficulty with particular tasks), population aged 15+ years CSD (2012) Numerator: Number of CSD respondents, aged 15+, who had a mild, moderate, severe, or very severe disability; Denominator: CSD respondents, aged 15+ Details of Disability (aged 15+) (prevalence %)
Mental Illness and Suicide
Indicator Details Source (Year) Method of Calculation Available Stratifiers
Suicide mortality (mortality rate per 100,000) Suicide deaths (ICD-10: X60 to X84), total population VS-DD (2009-2011) Numerator: Number of deaths caused by suicide; Denominator: Total Canadian population (2011 Census counts), multiplied by 3 Details of Suicide mortality (mortality rate per 100,000)
Mental illness hospitalization (aged 15+) (discharge rate per 100,000) Discharges following hospitalizations for five selected mental illness conditions (combined): substance-related disorders; schizophrenia, delusional and non-organic psychotic disorders; mood/affective disorders; anxiety disorders; and selected disorders of adult personality and behaviour, population aged 15+ HMHDB-CIHI (2009-2012) Numerator: Discharges following mental illness hospitalizations for the five selected mental illness conditions (combined); Denominator: Total within population of interest (2011 Census counts), multiplied by 4 Details of Mental illness hospitalization (aged 15+) (discharge rate per 100,000)
Self-Assessed Physical and Mental Health
Indicator Details Source (Year) Method of Calculation Available Stratifiers
Perceived health, excellent or very good (aged 12-17) (prevalence %) Reported their own health status as being either "excellent" or "very good", population aged 12-17 years CCHS (2010-2013) Numerator: Number of CCHS respondents, aged 12-17, who reported their own health status as being either "excellent" or "very good"; Denominator: CCHS respondents, aged 12-17 Details of Perceived health, excellent or very good (aged 12-17) (prevalence %)
Perceived health, excellent or very good (aged 18+) (prevalence %) Reported their own health status as being either "excellent" or "very good", population aged 18+ years CCHS (2010-2013) Numerator: Number of CCHS respondents, aged 18+, who reported their own health status as being either "excellent" or "very good"; Denominator: CCHS respondents, aged 18+ Details of Perceived health, excellent or very good (aged 18+) (prevalence %)
Perceived health, fair or poor (aged 12-17) (prevalence %) Reported their own health status as being either "fair" or "poor", population aged 12-17 years CCHS (2010-2013) Numerator: Number of CCHS respondents, aged 12-17, who reported their own health status as being either "fair" or "poor"; Denominator: CCHS respondents, aged 12-17 Details of Perceived health, fair or poor (aged 12-17) (prevalence %)
Perceived health, fair or poor (aged 18+) (prevalence %) Reported their own health status as being either "fair" or "poor", population aged 18+ years CCHS (2010-2013) Numerator: Number of CCHS respondents, aged 18+, who reported their own health status as being either "fair" or "poor"; Denominator: CCHS respondents, aged 18+ Details of Perceived health, fair or poor (aged 18+) (prevalence %)
Perceived mental health, excellent or very good (aged 12-17) (prevalence %) Reported their own mental health status as being either "excellent" or "very good", population aged 12-17 years CCHS (2010-2013) Numerator: Number of CCHS respondents, aged 12-17, who reported their own mental health status as being either "excellent" or "very good"; Denominator: CCHS respondents, aged 12-17 Details of Perceived mental health, excellent or very good (aged 12-17) (prevalence %)
Perceived mental health, excellent or very good (aged 18+) (prevalence %) Reported their own mental health status as being either "excellent" or "very good", population aged 18+ years CCHS (2010-2013) Numerator: Number of CCHS respondents, aged 18+, who reported their own mental health status as being either "excellent" or "very good"; Denominator: CCHS respondents, aged 18+ Details of Perceived mental health, excellent or very good (aged 18+) (prevalence %)
Perceived mental health, fair or poor (aged 12-17) (prevalence %) Reported their own mental health status as being either "fair" or "poor", population aged 12-17 years CCHS (2010-2013) Numerator: Number of CCHS respondents, aged 12-17, who reported their own mental health status as being either "fair" or "poor"; Denominator: CCHS respondents, aged 12-17 Details of Perceived mental health, fair or poor (aged 12-17) (prevalence %)
Perceived mental health, fair or poor (aged 18+) (prevalence %) Reported their own mental health status as being either "fair" or "poor", population aged 18+ years CCHS (2010-2013) Numerator: Number of CCHS respondents, aged 18+, who reported their own mental health status as being either "fair" or "poor"; Denominator: CCHS respondents, aged 18+ Details of Perceived mental health, fair or poor (aged 18+) (prevalence %)
Disease/Health Condition
Indicator Details Source (Year) Method of Calculation Available Stratifiers
Cancer incidence - total for all cancers (incidence rate per 100,000) New primary sites of cancer (malignant and neoplasm), total population CCR (2008-2010) Numerator: Total number of new primary sites of cancer; Denominator: Total Canadian population (2011 Census counts), multiplied by 3 Details of Cancer incidence - total for all cancers (incidence rate per 100,000)
Female breast cancer incidence (incidence rate per 100,000) New primary sites of female breast cancer (malignant and neoplasm) (ICD-O-3: C50.0 to C50.9), all females CCR (2008-2010) Numerator: Total number of new primary sites of female breast cancer; Denominator: Total Canadian population of females (2011 Census counts), multiplied by 3 Details of Female breast cancer incidence (incidence rate per 100,000)
Prostate cancer incidence (incidence rate per 100,000) New primary sites of prostate cancer (malignant and neoplasm) (ICD-O-3: C61.9), all males CCR (2008-2010) Numerator: Total number of new primary sites of prostate cancer; Denominator: Total Canadian population of males (2011 Census counts), multiplied by 3 Details of Prostate cancer incidence (incidence rate per 100,000)
Colorectal cancer incidence (incidence rate per 100,000) New primary sites of colorectal cancer (malignant and neoplasm) (ICD-O-3: C18.0 to C18.9, C19.9, C20.9, C26.0), total population CCR (2008-2010) Numerator: Total number of new primary sites of colorectal cancer; Denominator: Total Canadian population (2011 Census counts), multiplied by 3 Details of Colorectal cancer incidence (incidence rate per 100,000)
Lung cancer incidence (incidence rate per 100,000) New primary sites of lung cancer (malignant and neoplasm) (ICD-O-3: C34.0 to C34.9), total population CCR (2008-2010) Numerator: Total number of new primary sites of lung cancer; Denominator: Total Canadian population (2011 Census counts), multiplied by 3 Details of Lung cancer incidence (incidence rate per 100,000)
Arthritis (aged 18+) (prevalence %) Reported that they have been diagnosed by a health professional as having arthritis, population aged 18+ years CCHS (2010-2013) Numerator: Number of CCHS respondents, aged 18+, who reported that they have been diagnosed by a health professional as having arthritis; Denominator: CCHS respondents, aged 18+ Details of Arthritis (aged 18+) (prevalence %)
Asthma (aged 12-17) (prevalence %) Reported that they have been diagnosed by a health professional as having asthma, population aged 12-17 years CCHS (2010-2013) Numerator: Number of CCHS respondents, aged 12-17, who reported that they have been diagnosed by a health professional as having asthma; Denominator: CCHS respondents, aged 12-17 Details of Asthma (aged 12-17) (prevalence %)
Asthma (aged 18+) (prevalence %) Reported that they have been diagnosed by a health professional as having asthma, population aged 18+ years CCHS (2010-2013) Numerator: Number of CCHS respondents, aged 18+, who reported that they have been diagnosed by a health professional as having asthma; Denominator: CCHS respondents, aged 18+ Details of Asthma (aged 18+) (prevalence %)
Diabetes, including gestational (self-reported, aged 18+) (prevalence %) Reported they have been diagnosed by a health professional as having diabetes (including gestational diabetes), population aged 18+ years CCHS (2010-2013) Numerator: Number of CCHS respondents, aged 18+, who reported that they have been diagnosed by a health professional as having diabetes (including gestational diabetes); Denominator: CCHS respondents, aged 18+ Details of Diabetes, including gestational (self-reported, aged 18+) (prevalence %)
Diabetes, excluding gestational (self-reported, aged 18+) (prevalence %) Reported they have been diagnosed by a health professional as having diabetes (excluding gestational diabetes), population aged 18+ years CCHS (2010-2013) Numerator: Number of CCHS respondents, aged 18+, who reported that they have been diagnosed by a health professional as having diabetes (excluding gestational diabetes); Denominator:CCHS respondents, aged 18+ Details of Diabetes, excluding gestational (self-reported, aged 18+) (prevalence %)
Diabetes, excluding gestational (self-reported and measured, aged 18-79) (prevalence %) Reported and measured diabetes (excluding gestational diabetes), population aged 18-79 years CHMS Cycle 2 & Cycle 3 (2009-2013) Numerator: Number of CHMS respondents, aged 18-79, with diabetes (excluding gestational) from self-report and laboratory-measured blood values; Denominator: CHMS respondents, aged 18-79 Details of Diabetes, excluding gestational (self-reported and measured, aged 18-79) (prevalence %)
Dental pain or discomfort, past month (aged 12-17) (prevalence %) Reported they sometimes or often experienced pain/discomfort in their teeth/gums in the past month, population aged 12-17 years CCHS (2007-2008) Numerator: Number of CCHS respondents, aged 12-17, who report that they sometimes or often experienced pain/discomfort in their teeth/gums in the past month; Denominator: CCHS respondents, aged 12-17 Details of Dental pain or discomfort, past month (aged 12-17) (prevalence %)
Dental pain or discomfort, past month (aged 18+) (prevalence %) Reported they sometimes or often experienced pain/discomfort in their teeth/gums in the past month, population aged 18+ years CCHS (2007-2008) Numerator: Number of CCHS respondents, aged 18+, who report that they sometimes or often experienced pain/discomfort in their teeth/gums in the past month; Denominator: CCHS respondents, aged 18+ Details of Dental pain or discomfort, past month (aged 18+) (prevalence %)
Inability to chew (aged 12-17) (prevalence %) Reported they have an inability to chew, population aged 12-17 years CCHS (2007-2008) Numerator: Number of CCHS respondents, aged 12-17, who reported that they have an inability to chew; Denominator: CCHS respondents, aged 12-17 Details of Inability to chew (aged 12-17) (prevalence %)
Inability to chew (aged 18+) (prevalence %) Reported they have an inability to chew, population aged 18+ years CCHS (2007-2008) Numerator: Number of CCHS respondents, aged 18+, who reported that they have an inability to chew; Denominator: CCHS respondents, aged 18+ Details of Inability to chew (aged 18+) (prevalence %)
Decay-missing-filled-teeth (DMFT/dmft) index (aged 6-17) (prevalence %) Have decayed, missing, or filled permanent (DMFT) or primary teeth (dmft) (index >= 1), population aged 6-17 years CHMS (2007-2009) Numerator: Number of CHMS respondents, aged 6-17, with decayed, missing, or filled permanent or primary teeth (DMFT/dmft index >= 1); Denominator: CHMS respondents, aged 6-17 Details of Decay-missing-filled-teeth (DMFT/dmft) index (aged 6-17) (prevalence %)
Missing teeth (<21 teeth, aged 18-79) (prevalence %) Have missing teeth and fewer than 21 remaining, population aged 18-79 years CHMS (2007-2009) Numerator: Number of CHMS respondents, aged 18-79, with less than 21 teeth remaining; Denominator: CHMS respondents, aged 18-79 Details of Missing teeth (<21 teeth, aged 18-79) (prevalence %)
Active tuberculosis disease (reported cases) (incidence rate per 100,000) Active tuberculosis cases (newly diagnosed or re-treatment) CTBRS (2010-2014) Five years cumulative; Numerator: [2010-2012] PHAC (2015), Tuberculosis in Canada 2012 / [2013] PHAC (2015), Tuberculosis in Canada 2013 – Pre-release / [2014] PHAC (2016), Tuberculosis in Canada 2014 – Pre-release; Denominator: [First Nations on and off reserve, 2010-2012] Registered Indian Population, Household and Family Projections 2004-2029, INAC (2007) / [First Nations on and off reserve, 2013 and 2014] AANDC (2012), Registered Indian Population, Household and Family Projections 2009-2034 / [Inuit and Métis and Total Indigenous, 2010-2012] StatCan, Projections of the Aboriginal populations, Canada, provinces and territories 2001 to 2017 (Catalogue No. 91-547-XIE) / [Inuit and Métis and Total Indigenous, 2013 and 2014] StatCan, Population Projections by Aboriginal Identity in Canada, 2006 to 2031 (Catalogue No. 91-552-X) / [Foreign-born population, 2010-2012] StatCan, Custom Product / [Foreign-born population, 2013 and 2014] StatCan, Custom Tabulation - 2011 NHS. Details of Active tuberculosis disease (reported cases) (incidence rate per 100,000)
HIV incidence (estimate per 100,000 population) Estimate of new HIV cases in the population National HIV/AIDS Surveillance System (2011) Numerator: Estimated number of new HIV cases; Denominator: Population of Canada (and sub-populations, source dependant on stratifier) Details of HIV incidence (estimate per 100,000 population)
HIV diagnosis rate (per 100,000 population) Average annual rate of reported HIV diagnoses National HIV/AIDS Surveillance System (2009-2014) Six-year average of annual rates of HIV diagnoses Details of HIV diagnosis rate (per 100,000 population)

Health Determinants

Health Behaviours
Indicator Details Source (Year) Method of Calculation Available Stratifiers
Alcohol use, heavy drinking (aged 12-17) (prevalence %) Reported having had 5 or more drinks in one occasion, between once a month to more than once a week over the past year, population aged 12-17 years CCHS (2010-2012) Numerator: Number of CCHS respondents, aged 12-17, who reported having 5 or more drinks in one occasion, between once a month to more than once a week over the past year; Denominator: CCHS respondents, aged 12-17 Details of Alcohol use, heavy drinking (aged 12-17) (prevalence %)
Alcohol use, heavy drinking (aged 18+) (prevalence %) Reported having had 5 or more drinks in one occasion, between once a month to more than once a week over the past year, population aged 18+ years CCHS (2010-2012) Numerator: Number of CCHS respondents, aged 18+, who reported having 5 or more drinks in one occasion, between once a month to more than once a week over the past year; Denominator: CCHS respondents, aged 18+ Details of Alcohol use, heavy drinking (aged 18+) (prevalence %)
Smoking, daily or occasionally (aged 12-17) (prevalence %) Reported being a current smoker (either daily or occasional), does not take into account the number of cigarettes smoked, population aged 12-17 years CCHS (2010-2013) Numerator: Number of CCHS respondents, aged 12-17, who reported being a current smoker (either daily or occasional); Denominator: CCHS respondents, aged 12-17 Details of Smoking, daily or occasionally (aged 12-17) (prevalence %)
Smoking, daily or occasionally (aged 18+) (prevalence %) Reported being a current smoker (either daily or occasional), does not take into account the number of cigarettes smoked, population aged 18+ years CCHS (2010-2013) Numerator: Number of CCHS respondents, aged 18+, who reported being a current smoker (either daily or occasional); Denominator: CCHS respondents, aged 18+ Details of Smoking, daily or occasionally (aged 18+) (prevalence %)
Breastfeeding, initiation (aged 18-55) (prevalence %) Women aged 18-55 years, who breastfed or tried to breastfeed their last child (including short duration) CCHS (2009-2012) Numerator: Number of female CCHS respondents, aged 18-55, who initiated breastfeeding (or tried to initiate breastfeeding) with their last child; Denominator: Female CCHS respondents, aged 18-55 Details of Breastfeeding, initiation (aged 18-55) (prevalence %)
Breastfeeding, exclusive (aged 18-55) (prevalence %) Women aged 18-55 years who breastfed their child exclusively for at least the first 6 months of life (the child received only breast milk, without any additional liquid or solid food) CCHS (2009-2012) Numerator: Number of female CCHS respondents, aged 18-55, who breastfed their last child exclusively for at least the first 6 months of life; Denominator: Female CCHS respondents, aged 18-55 Details of Breastfeeding, exclusive (aged 18-55) (prevalence %)
Fruit/vegetable consumption, 5 or more times per day (aged 12-17) (prevalence %) Reported consuming fruits and vegetables 5 times or more per day, population aged 12-17 years CCHS (2010-2013) Numerator: Number of CCHS respondents, aged 12-17, who reported consuming fruits and vegetables 5 times or more per day; Denominator: CCHS respondents, aged 12-17 Details of Fruit/vegetable consumption, 5 or more times per day (aged 12-17) (prevalence %)
Fruit/vegetable consumption, 5 or more times per day (aged 18+) (prevalence %) Reported consuming fruits and vegetables 5 times or more per day, population aged 18+ years CCHS (2010-2013) Numerator: Number of CCHS respondents, aged 18+, who reported consuming fruits and vegetables 5 times or more per day; Denominator: CCHS respondents, aged 18+ Details of Fruit/vegetable consumption, 5 or more times per day (aged 18+) (prevalence %)
Physical activity, active or moderately active (aged 12-17) (prevalence %) Respondents classified as "active" or "moderately active", based on their responses to questions about the frequency, nature and duration of their participation in leisure time physical activity, population aged 12-17 years CCHS (2010-2013) Numerator: Number of CCHS respondents, aged 12-17, who were classified as "active" or "moderately active", based on their responses to questions about the frequency, nature and duration of their participation in leisure time physical activity; Denominator: CCHS respondents, aged 12-17 Details of Physical activity, active or moderately active (aged 12-17) (prevalence %)
Physical activity, active or moderately active (aged 18+) (prevalence %) Respondents classified as "active" or "moderately active", based on their responses to questions about the frequency, nature and duration of their participation in leisure time physical activity, population aged 18+ years CCHS (2010-2013) Numerator: Number of CCHS respondents, aged 18+, who were classified as "active" or "moderately active", based on their responses to questions about the frequency, nature and duration of their participation in leisure time physical activity; Denominator: CCHS respondents, aged 18+ Details of Physical activity, active or moderately active (aged 18+) (prevalence %)
Physical and Social Environment
Indicator Details Source (Year) Method of Calculation Available Stratifiers
Exposure to second-hand smoke at home (aged 12-17) (prevalence %) Current non-smokers who reported exposure to second hand smoke at home, population aged 12-17 years CCHS (2010-2013) Numerator: Number of CCHS respondents, aged 12-17, who reported that they do not smoke and that at least one person smoked inside their home every day or almost every day; Denominator: CCHS respondents, who reported that they do not smoke, aged 12-17 Details of Exposure to second-hand smoke at home (aged 12-17) (prevalence %)
Exposure to second-hand smoke at home (aged 18+) (prevalence %) Current non-smokers who reported exposure to second hand smoke at home, population aged 18+ years CCHS (2010-2013) Numerator: Number of CCHS respondents, aged 18+, who reported that they do not smoke and that at least one person smoked inside their home every day or almost every day; Denominator: CCHS respondents, who reported that they do not smoke, aged 18+ Details of Exposure to second-hand smoke at home (aged 18+) (prevalence %)
Exposure to second-hand smoke in vehicles or public places, past month (aged 12-17) (prevalence %) Current non-smokers who reported exposure to second-hand smoke in public places or private vehicles, in the past month, population aged 12-17 years CCHS (2010-2013) Numerator: Number of CCHS respondents, aged 12-17, who reported that they do not smoke and who reported being exposed to second-hand smoke in private vehicles and/or public places every day or almost every day during the past month; Denominator: CCHS respondents, who reported that they do not smoke, aged 12-17 Details of Exposure to second-hand smoke in vehicles or public places, past month (aged 12-17) (prevalence %)
Exposure to second-hand smoke in vehicles or public places, past month (aged 18+) (prevalence %) Current non-smokers who reported exposure to second-hand smoke in public places or private vehicles, in the past month, population aged 18+ years CCHS (2010-2013) Numerator: Number of CCHS respondents, aged 18+, who reported that they do not smoke and who reported being exposed to second-hand smoke in private vehicles and/or public places every day or almost every day during the past month; Denominator: CCHS respondents, who reported that they do not smoke, aged 18+ Details of Exposure to second-hand smoke in vehicles or public places, past month (aged 18+) (prevalence %)
Sense of community belonging, somewhat or very strong (aged 12-17) (prevalence %) Reported a sense of belonging to their local community as being very strong or somewhat strong, population aged 12-17 years CCHS (2010-2013) Numerator: Number of CCHS respondents, aged 12-17, who reported a sense of belonging to their local community as being somewhat strong or very strong; Denominator: CCHS respondents, aged 12-17 Details of Sense of community belonging, somewhat or very strong (aged 12-17) (prevalence %)
Sense of community belonging, somewhat or very strong (aged 18+) (prevalence %) Reported a sense of belonging to their local community as being very strong or somewhat strong, population aged 18+ years CCHS (2010-2013) Numerator: Number of CCHS respondents, aged 18+, who reported a sense of belonging to their local community as being somewhat strong or very strong; Denominator: CCHS respondents, aged 18+ Details of Sense of community belonging, somewhat or very strong (aged 18+) (prevalence %)
Housing below standards (prevalence %) People for whom housing is either: not affordable (≥ 30% of annual household income), in need of major repair, or is not a sufficient size NHS (2011) Numerator: Number of people whose housing is either: not affordable (≥ 30% of annual household income), requires major repairs, or size is not sufficient; Denominator: Number of people for whom answers to questions about housing affordability, adequacy (requiring major repairs) and suitability (sufficient size) were available Details of Housing below standards (prevalence %)
Working Conditions
Indicator Details Source (Year) Method of Calculation Available Stratifiers
Workplace stress, quite a bit or extremely stressful, past year (aged 15-17) (prevalence %) Reported that their workplace was quite stressful or extremely stressful, in the past year, population aged 15-17 years CCHS (2010-2013) Numerator: Number of CCHS respondents who worked at a job or business in the past year, aged 15-17, who reported that their workplace was quite or extremely stressful, in the past year; Denominator: CCHS respondents who worked at a job or business in the past year, aged 15-17 Details of Workplace stress, quite a bit or extremely stressful, past year (aged 15-17) (prevalence %)
Workplace stress, quite a bit or extremely stressful, past year (aged 18-75) (prevalence %) Reported that their workplace was quite stressful or extremely stressful, in the past year, population aged 18-75 years CCHS (2010-2013) Numerator: Number of CCHS respondents who worked at a job or business in the past year, aged 18-75, who reported that their workplace was quite or extremely stressful, in the past year; Denominator: CCHS respondents who worked at a job or business in the past year, aged 18-75 Details of Workplace stress, quite a bit or extremely stressful, past year (aged 18-75) (prevalence %)
Health Care
Indicator Details Source (Year) Method of Calculation Available Stratifiers
Contact with medical doctor, past year (aged 12-17) (prevalence %) Reported having seen or talked to a family doctor, pediatrician, general practitioner, or any other medical doctor or specialist, such as a surgeon, allergist, orthopaedist, gynaecologist/urologist, or psychiatrist (about their physical, emotional or mental health) in past year, population aged 12-17 years CCHS (2009, 2010, 2012, 2013) Numerator: Number of CCHS respondents, aged 12-17, who reported having seen or talked to a medical doctor or specialist in past year; Denominator: CCHS respondents, aged 12-17 Details of Contact with medical doctor, past year (aged 12-17) (prevalence %)
Contact with medical doctor, past year (aged 18+) (prevalence %) Reported having seen or talked to a family doctor, general practitioner, or any other medical doctor or specialist, such as a surgeon, allergist, orthopaedist, gynaecologist/urologist, or psychiatrist (about their physical, emotional or mental health) in past year, population aged 18+ years CCHS (2009, 2010, 2012, 2013) Numerator: Number of CCHS respondents, aged 18+, who reported having seen or talked to a medical doctor or specialist in past year; Denominator: CCHS respondents, aged 18+ Details of Contact with medical doctor, past year (aged 18+) (prevalence %)
Mammography screening, past 5 years (aged 50-74) (prevalence %) Reported that they had their most recent mammogram within the past 5 years, women aged 50-74 years CCHS (2008, 2012) Numerator: Number of female CCHS respondents, aged 50-74, who reported that they had their most recent mammogram within the past 5 years; Denominator: Female CCHS respondents, aged 50-74 Details of Mammography screening, past 5 years (aged 50-74) (prevalence %)
Pap smear screening, past 3 years (aged 25-69) (prevalence %) Reported their last pap smear in the past 3 years, women aged 25-69 years CCHS (2008, 2012) Numerator: Number of female CCHS respondents, aged 25-69 who reported that they had their most recent pap smear test within the past 3 years; Denominator: Female CCHS respondents, aged 25-69 Details of Pap smear screening, past 3 years (aged 25-69) (prevalence %)
Colorectal cancer screening, past 5 years (aged 50-74) (prevalence %) Reported that they had their last fecal occult blood test in the past 2 years, or colonoscopy or sigmoidoscopy in past 5 years, population aged 50-74 years CCHS (2008, 2012) Numerator: Number of CCHS respondents, aged 50-74, who reported that they had their last fecal occult blood test in the past 2 years, or colonoscopy or sigmoidoscopy in past 5 years; Denominator: CCHS respondents, aged 50-74 Details of Colorectal cancer screening, past 5 years (aged 50-74) (prevalence %)
Absence of dental insurance (aged 6-17) (prevalence %) Reported having no insurance (or government program) coverage, for dental expenses, population aged 6-17 years CHMS (2007-2009) Numerator: Number of CHMS respondents, aged 6-17, who reported having no insurance or government program coverage for dental expeses; Denominator: CHMS respondents, aged 6-17 Details of Absence of dental insurance (aged 6-17) (prevalence %)
Absence of dental insurance (aged 18-79) (prevalence %) Reported having no insurance (or government program) coverage, for dental expenses, population aged 18-79 years CHMS (2007-2009) Numerator: Number of CHMS respondents, aged 18-79, who reported having no insurance or government program coverage for dental expenses; Denominator: CHMS respondents, aged 18-79 Details of Absence of dental insurance (aged 18-79) (prevalence %)
Contact with dental professional, past year (aged 12-17) (prevalence %) Reported having seen or talked to a dentist, dental hygienist or orthodontist in the past year, population aged 12-17 years CCHS (2009, 2010, 2012, 2013) Numerator: Number of CCHS respondents, aged 12-17, within the population of interest who reported having seen or talked to a dentist, dental hygienist or orthodontist in the past year; Denominator: CCHS respondents, aged 12-17 Details of Contact with dental professional, past year (aged 12-17) (prevalence %)
Contact with dental professional, past year (aged 18+) (prevalence %) Reported having seen or talked to a dentist, dental hygienist or orthodontist in the past year, population aged 18+ years CCHS (2009, 2010, 2012, 2013) Numerator: Number of CCHS respondents, aged 18+, within the population of interest who reported having seen or talked to a dentist, dental hygienist or orthodontist in the past year; Denominator: CCHS respondents, aged 18+ Details of Contact with dental professional, past year (aged 18+) (prevalence %)
Not seen dental professional, past year (aged 6-17) (prevalence %) Reported not having seen a dental professional in the past year, among those who usually visit a dental professional, population aged 6-17 years CHMS (2007-2009) Numerator: Number of CHMS respondents, aged 6-17, who reported not having seen a dental professional in the past 12 months; Denominator: CHMS respondents, who reported that they usually see a dental professional, aged 6-17 Details of Not seen dental professional, past year (aged 6-17) (prevalence %)
Not seen dental professional, past year (aged 18-79) (prevalence %) Reported not having seen a dental professional in the past year, among those who usually visit a dental professional, population aged 18-79 years CHMS (2007-2009) Numerator: Number of CHMS respondents who reported that they usually see a dental professional, aged 18-79, who reported not having seen a dental professional in the past 12 months; Denominator: CHMS respondents who reported that they usually see a dental professional, aged 18-79 Details of Not seen dental professional, past year (aged 18-79) (prevalence %)
Social Protection
Indicator Details Source (Year) Method of Calculation Available Stratifiers
Eligibility for employment insurance (aged 15-69) (proportion %) Beneficiaries of employment insurance (EI) among the unemployed, population aged 15-69 years EICS (2013) Numerator: Number of EICS respondents, aged 15-69, who were EI recipients; Denominator: EICS respondents, eligible for employment insurance, aged 15-69 Details of Eligibility for employment insurance (aged 15-69) (proportion %)
Daycare centre enrollment (aged 1-5) (prevalence %) Children aged 1-5 years in daycare centres SYC (2010-2011) Numerator: Total number of children aged 1 to 5 in daycare centre within the population of interest; Denominator: SYC respondents (PMK, on behalf of child aged 1-5) Details of Daycare centre enrollment (aged 1-5) (prevalence %)
Non-parental child care (aged 1-5) (prevalence %) Children aged 1-5 years in the care of someone other than a parent or guardian SYC (2010-2011) Numerator: Total number of children aged 1 to 5 in non-parental child care within the population of interest; Denominator: SYC respondents (PMK, on behalf of child aged 1-5) Details of Non-parental child care (aged 1-5) (prevalence %)
Subsidized care (aged 1-5) (prevalence %) Children aged 1-5 years in Canada (excluding Quebec) who are enrolled in a public subsidized child care program, or whose care is subject to subsidies or other financial assistance (other than tax deduction) SYC (2010-2011) Numerator: Total number of children aged 1 to 5 who are enrolled in a public subsidized care within the population of interest; Denominator: SYC respondents (PMK, on behalf of child aged 1-5) (Quebec is excluded from the numerator and denominator) Details of Subsidized care (aged 1-5) (prevalence %)
Social Inequities
Indicator Details Source (Year) Method of Calculation Available Stratifiers
Food insecurity, moderate or severe (individuals living in households with food insecurity, aged 12-17) (prevalence %) Proportion of children aged 12-17 years living in households with severe or moderate food insecurity, derived from self-reported income-related difficulties accessing or utilizing food that influence the quantity or quality of food consumed CCHS (2009-2012; NB and PE only 2011-2012) Numerator: Number of children aged 12-17 years who reported living in households with moderate to severe food insecurity; Denominator: CCHS respondents, aged 12-17 years Details of Food insecurity, moderate or severe (individuals living in households with food insecurity, aged 12-17) (prevalence %)
Food insecurity, moderate or severe (individuals living in households with food insecurity, aged 18+) (prevalence %) Proportion of adults aged 18+ years living in households with severe or moderate food insecurity, derived from self-reported income-related difficulties accessing or utilizing food that influence the quantity or quality of food consumed CCHS (2009-2012; NB and PE only 2011-2012) Numerator: Number of adults aged 18+ years who reported living in households with moderate to severe food insecurity; Denominator: CCHS respondents, aged 18+ years Details of Food insecurity, moderate or severe (individuals living in households with food insecurity, aged 18+) (prevalence %)
Children in low income families (according to low income cut-off) (prevalence %) Children living in households that fall below the after-tax low income cut-off (LICO), population aged 17 years and under NHS (2011) Numerator: Number of children living in economic families with incomes below after-tax LICO within the population of interest; Denominator: Population aged 17 years and under, covered by the NHS Details of Children in low income families (according to low income cut-off) (prevalence %)
Children in low income families (according to market basket measure) (prevalence %) Children living in households that fall below the market basket measure, population aged 17 years and under NHS (2011) Numerator: Number of children living in economic families with incomes below the market basket measure within the population of interest; Denominator: Population aged 17 years and under, covered by the NHS Details of Children in low income families (according to market basket measure) (prevalence %)
Working poor (aged 18-64) (prevalence %) People aged 18-64 (excluding students) who reported earning at least $3,000 per year, living independently and not with their family of origin, with an after-tax income below the low income measure (LIM) NHS (2011) Numerator: Number of people, aged 18-64 (excluding students) who reported earning at least $3,000 per year with an after-tax income below the LIM, living independently and not with their family of origin; Denominator: Number of people, aged 18-64 (excluding students) who reported earning at least $3,000 per year, living independently and not with their family of origin, and whose after-tax income could be evaluated in relation to the LIM Details of Working poor (aged 18-64) (prevalence %)
Early Childhood Development
Indicator Details Source (Year) Method of Calculation Available Stratifiers
Children vulnerable in at least one domain of early development (proportion %) Kindergarten children who are vulnerable in one or more developmental domains (physical health and well-being, social competence, emotional maturity, language and cognitive development, communication skills and general knowledge) upon entry into school Early Development Instrument, Offord Centre for Child Studies (EDI) (Various school years: PEI 2007-2008; NB 2008-2009; BC, MB, and SK 2010-2011; ON, QC, YK, and NT 2011-2012) Numerator: Number of kindergarten children vulnerable in one or more developmental domains (physical health and well-being, social competence, emotional maturity, language and cognitive development, communication skills and general knowledge); Denominator: All kindergarten-aged children in the participating provinces or territories with EDI data (BC, MB, NB, NT, ON, PE, QC, SK, YT) Details of Children vulnerable in at least one domain of early development (proportion %)
Children vulnerable in domain of physical health and well-being (proportion %) Kindergarten children who are vulnerable in domain of physical health and well-being upon entry into school Early Development Instrument, Offord Centre for Child Studies (EDI) (Various school years: PEI 2007-2008; NB 2008-2009; BC, MB, and SK 2010-2011; ON, QC, YK, and NT 2011-2012) Numerator: Number of kindergarten children vulnerable in domain of physical health and well-being; Denominator: All kindergarten-aged children in the participating provinces or territories with EDI data (BC, MB, NB, NT, ON, PE, QC, SK, YT) Details of Children vulnerable in domain of physical health and well-being (proportion %)
Children vulnerable in domain of social competence (proportion %) Kindergarten children who are vulnerable in domain of social competence upon entry into school Early Development Instrument, Offord Centre for Child Studies (EDI) (Various school years: PEI 2007-2008; NB 2008-2009; BC, MB, and SK 2010-2011; ON, QC, YK, and NT 2011-2012) Numerator: Number of kindergarten children vulnerable in domain of social competence; Denominator: All kindergarten-aged children in the participating provinces or territories with EDI data (BC, MB, NB, NT, ON, PE, QC, SK, YT) Details of Children vulnerable in domain of social competence (proportion %)
Children vulnerable in domain of emotional maturity (proportion %) Kindergarten children who are vulnerable in domain of emotional maturity upon entry into school Early Development Instrument, Offord Centre for Child Studies (EDI) (Various school years: PEI 2007-2008; NB 2008-2009; BC, MB, and SK 2010-2011; ON, QC, YK, and NT 2011-2012) Numerator: Number of kindergarten children vulnerable in domain of emotional maturity; Denominator: All kindergarten-aged children in the participating provinces or territories with EDI data (BC, MB, NB, NT, ON, PE, QC, SK, YT) Details of Children vulnerable in domain of emotional maturity (proportion %)
Children vulnerable in domain of language and cognitive development (proportion %) Kindergarten children who are vulnerable in domain of language and cognitive development upon entry into school Early Development Instrument, Offord Centre for Child Studies (EDI) (Various school years: PEI 2007-2008; NB 2008-2009; BC, MB, and SK 2010-2011; ON, QC, YK, and NT 2011-2012) Numerator: Number of kindergarten children vulnerable in domain of language and cognitive development; Denominator: All kindergarten-aged children in the participating provinces or territories with EDI data (BC, MB, NB, NT, ON, PE, QC, SK, YT) Details of Children vulnerable in domain of language and cognitive development (proportion %)
Children vulnerable in domain of communication skills and general knowledge (proportion %) Kindergarten children who are vulnerable in domain of communication skills and general knowledge upon entry into school Early Development Instrument, Offord Centre for Child Studies (EDI) (Various school years: PEI 2007-2008; NB 2008-2009; BC, MB, and SK 2010-2011; ON, QC, YK, and NT 2011-2012) Numerator: Number of kindergarten children vulnerable in domain of communication skills and general knowledge; Denominator: All kindergarten-aged children in the participating provinces or territories with EDI data (BC, MB, NB, NT, ON, PE, QC, SK, YT) Details of Children vulnerable in domain of communication skills and general knowledge (proportion %)

More information is available about the measures of inequality used in this Data Tool.


Notes

  • Data Sources (Abbreviations): Canadian Cancer Registry (CCR); Canadian Community Health Survey - Annual Component (CCHS); Canadian Demographic Estimates, Canadian Health Measures Survey (CHMS); Canadian Survey on Disability (CSD); Canadian Tuberculosis Reporting System (CTBRS); Census Population Counts; Early Development Instrument, Offord Centre for Child Studies (EDI); Employment Insurance Coverage Survey (EICS); Hospital Mental Health Database, Canadian Institute for Health Information (HMHDB); National HIV/AIDS Surveillance System; National Household Survey (NHS); Survey of Young Canadians (SYC); Vital Statistics - Birth Database (VS-BD); Vital Statistics - Death Database (VS-DD).

  • Rates: Age-standardized to the 2011 Canadian population unless otherwise stated. Rates encompass incidence and prevalence. Consult the documentation for more details on a specific indicator.

  • Stratification: Where possible/applicable, indicators are stratified at the individual level by the following characteristics: individual respondent/household income (income quintile – provincial/national, overall and by rural/urban geography); education level/quintile (individual respondent/household, overall and by rural/urban geography); immigration status; First Nations/Inuit/Métis identity; deprivation index (social/material); employment status; occupation; rural/urban geography; cultural/racial background; sexual orientation; functional health; participation and activity limitation; and impact of health problems. In certain cases, categories within a stratifier are collapsed or replaced by a proxy measure in cases of small sample sizes or unavailable information. Consult the documentation for more details on the available stratifiers for a specific indicator.

    Ecological stratifiers are used in cases of missing or unavailable individual level characteristics. These measures are based on the use of area level measures1 of socio-economic status, sub-group (e.g. First Nations/Inuit/Métis identity, foreign-born2) concentration and rural/urban geography derived from the 2006 Census (long-form) at the Census Dissemination Area (DA) level and linked to the vital and cancer administrative data available at Statistics Canada using the Postal Code OM Conversion File Plus (PCCF+).

  • Data availability, validity and limitations: When an indicator and a stratifier are crossed, the age interval is limited to that available in both the indicator and the stratifier. The values calculated for the summary measures of inequalities do not take into account the complex intersections between different social identities or different social determinants of health that may vary between the groups. Consult the documentation on the summary measures of inequalities used in this project for more details. Data from national surveys were weighted to permit representative estimates of the target population. The 95% confidence interval illustrates the degree of variability associated with a number or a rate. Wide confidence intervals indicate high variability and should therefore be interpreted and compared with caution. For indicators using data linkage to the 2006 census data via the PCCF+, records that could not be assigned a DA were excluded from the analysis.

Suggested Citation: Pan-Canadian Health Inequalities Data Tool, 2017 Edition. A joint initiative of the Public Health Agency of Canada, the Pan-Canadian Public Health Network, Statistics Canada and the Canadian Institute of Health Information.

Correspondence: Determinants of Health Division, Public Health Agency of Canada, 9th floor, 785 Carling Avenue, A.L. 6809B, Ottawa, ON K1A 0K9; Email: HealthInequalities_InegalitesEnSante@phac-aspc.gc.ca

References:

Acknowledgements: The development of this Data Tool was made possible through collaboration of the Public Health Agency of Canada (PHAC), the Pan-Canadian Public Health Network (PHN), Statistics Canada, and the Canadian Institute for Health Information (CIHI). We wish to thank the members of the Pan-Canadian Health Inequalities Reporting Initiative Technical Working Group for their invaluable contributions to this product.

Date modified: